Geropathology Imaging - Part of the The Jackson Laboratory Shock Center of Excellence in the Basic Biology of Aging
Painting
Visualizing results is really important, we have devleoped a method for “painting” the age scores from the aging classifer so you cna visualize where your tissue is aging.
If you have not installed these programs you can get directions to do that here Required Software there are also links to the manuals and tutorials that both groups provide.
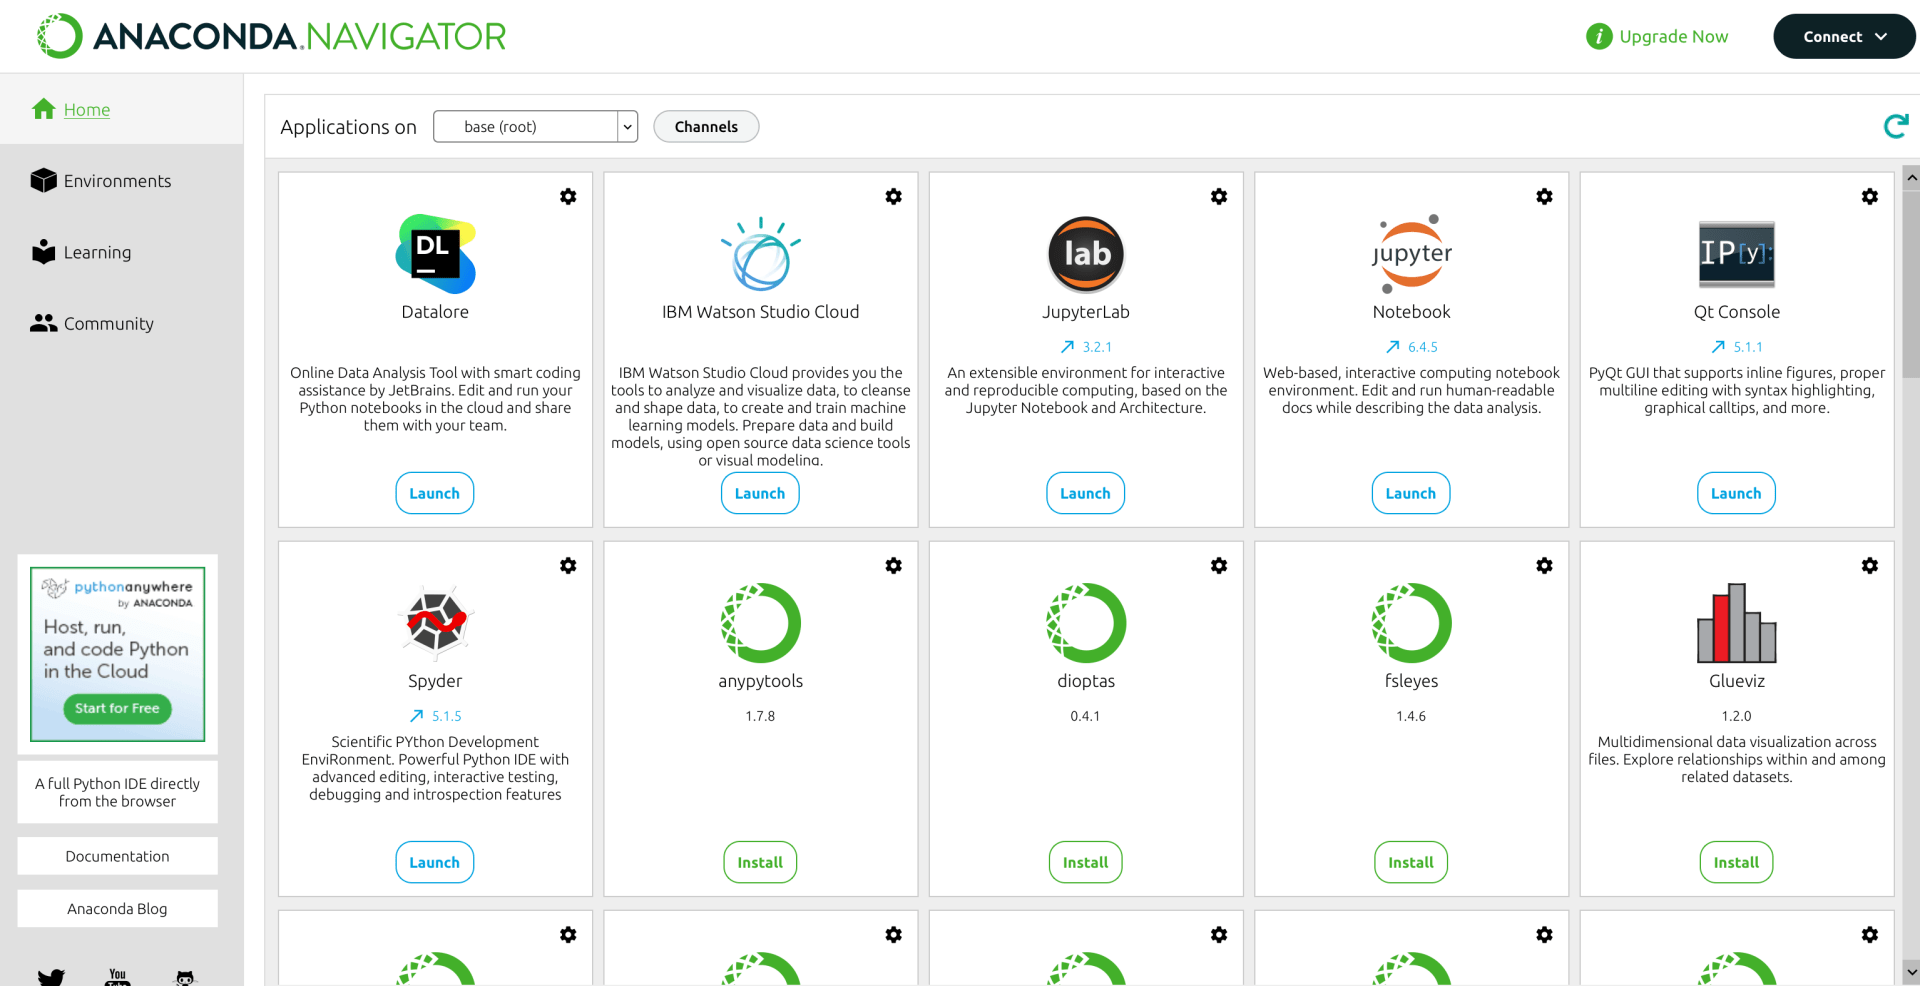
We will do with in a Jupyter Notebook. There are two ways to open a notebook we will provide directions using anaconda but you can do this on the command line by following the directions in jupyter

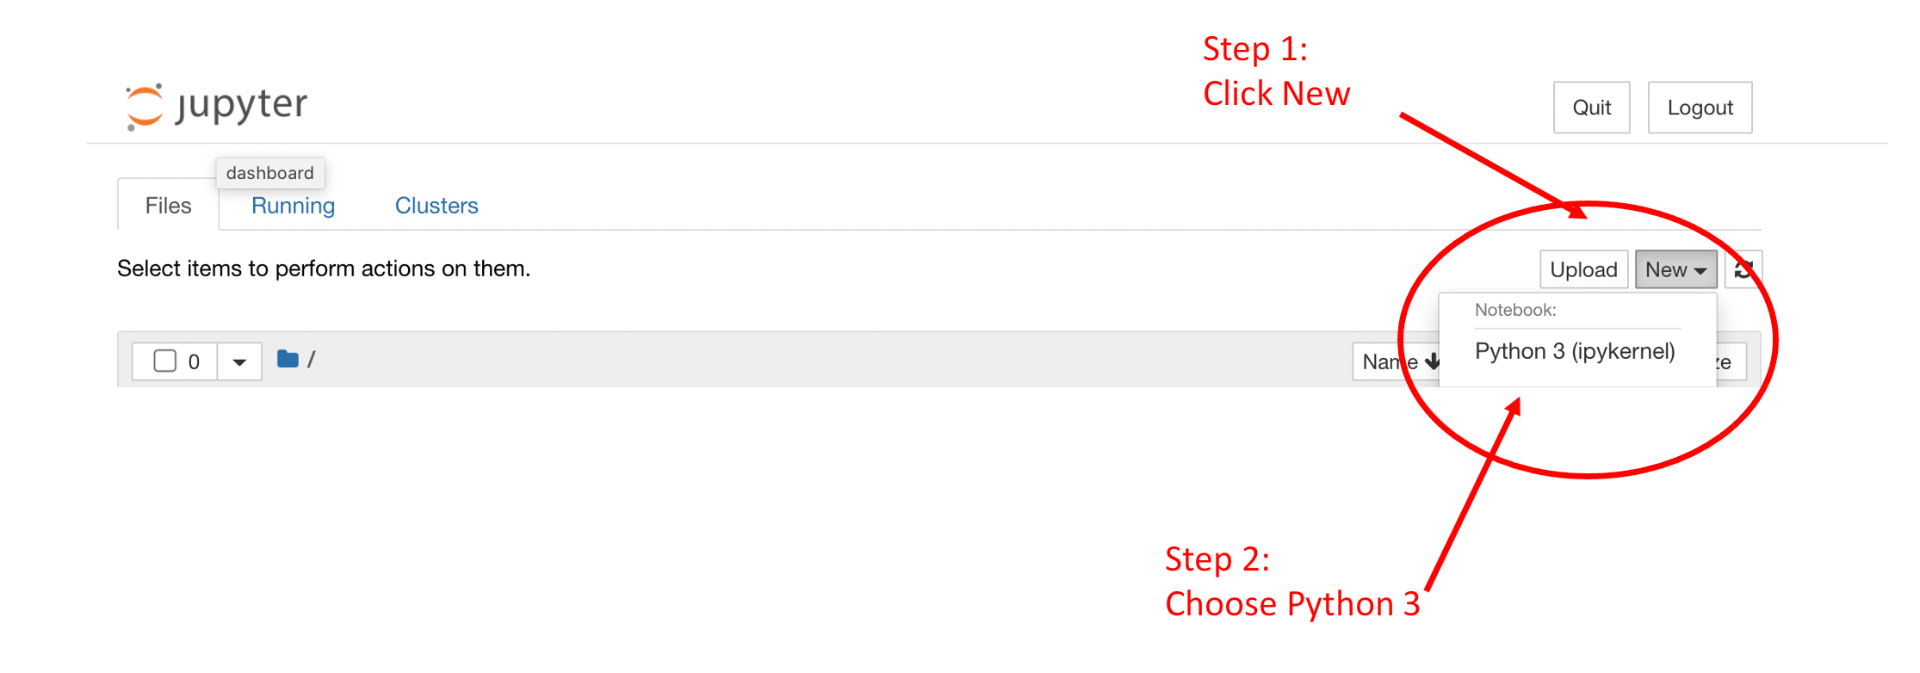
A jupyter notebook should open in your browser
Open a new juptyer notebook using python 3


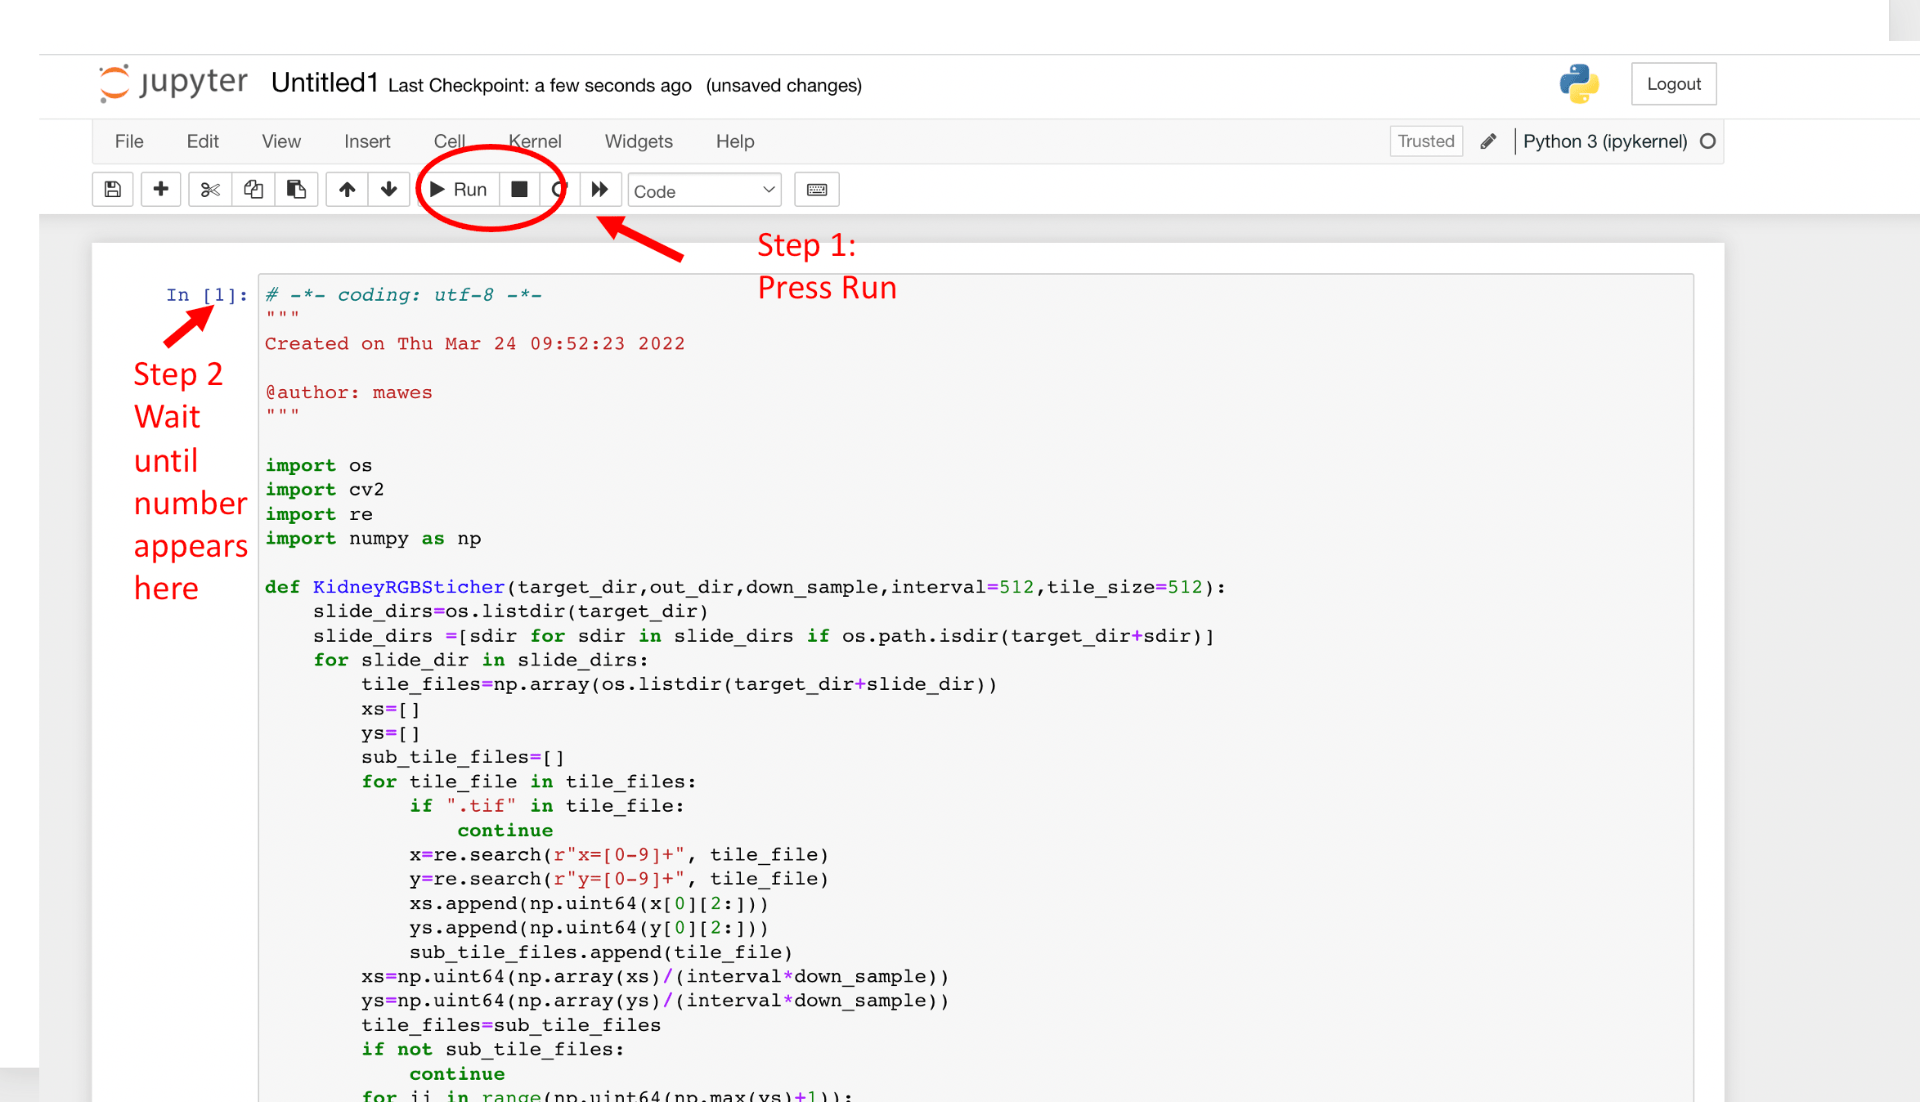
Copy the painting.ipynb script
You can get the script by downloading it from here https://github.com/TheJacksonLaboratory/DIY-Geropathology
Specific Tutorial on getting the code from Github is provided here (Note: use the painting.ipynbscript)
https://www.geropathology-imaging.org/copying-groovy-script-from-github-for-qupath/
Choose Run


Add a New Cell
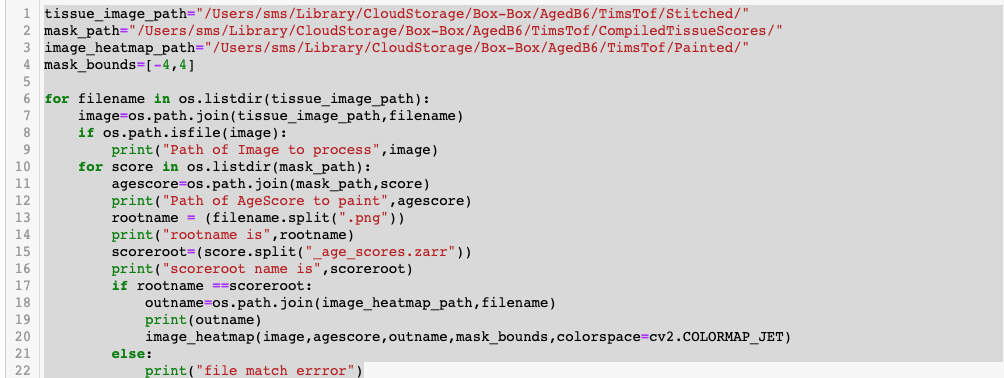
Adjust these file paths to match your project
tissue_image_path=”/Users/Stitched/”
mask_path=”/Users//CompiledAgecores/”
image_heatmap_path=”/Users/Painted/”
mask_bounds=[-4,4]
tissue_image_path is directory where your stitched file are this should be surrounded by double “
mask_path is the directory where to put the Complied age scores are this should be surrounded by double “
image_heatmap_path is the directory where you would like the painted images this should be surrounded by double “
If you are using our classifier the mask_bounds should be [-4 ro 4]


Choose Run
Painted files .png should be in output directory for each slide


